
Understanding The Dashboard
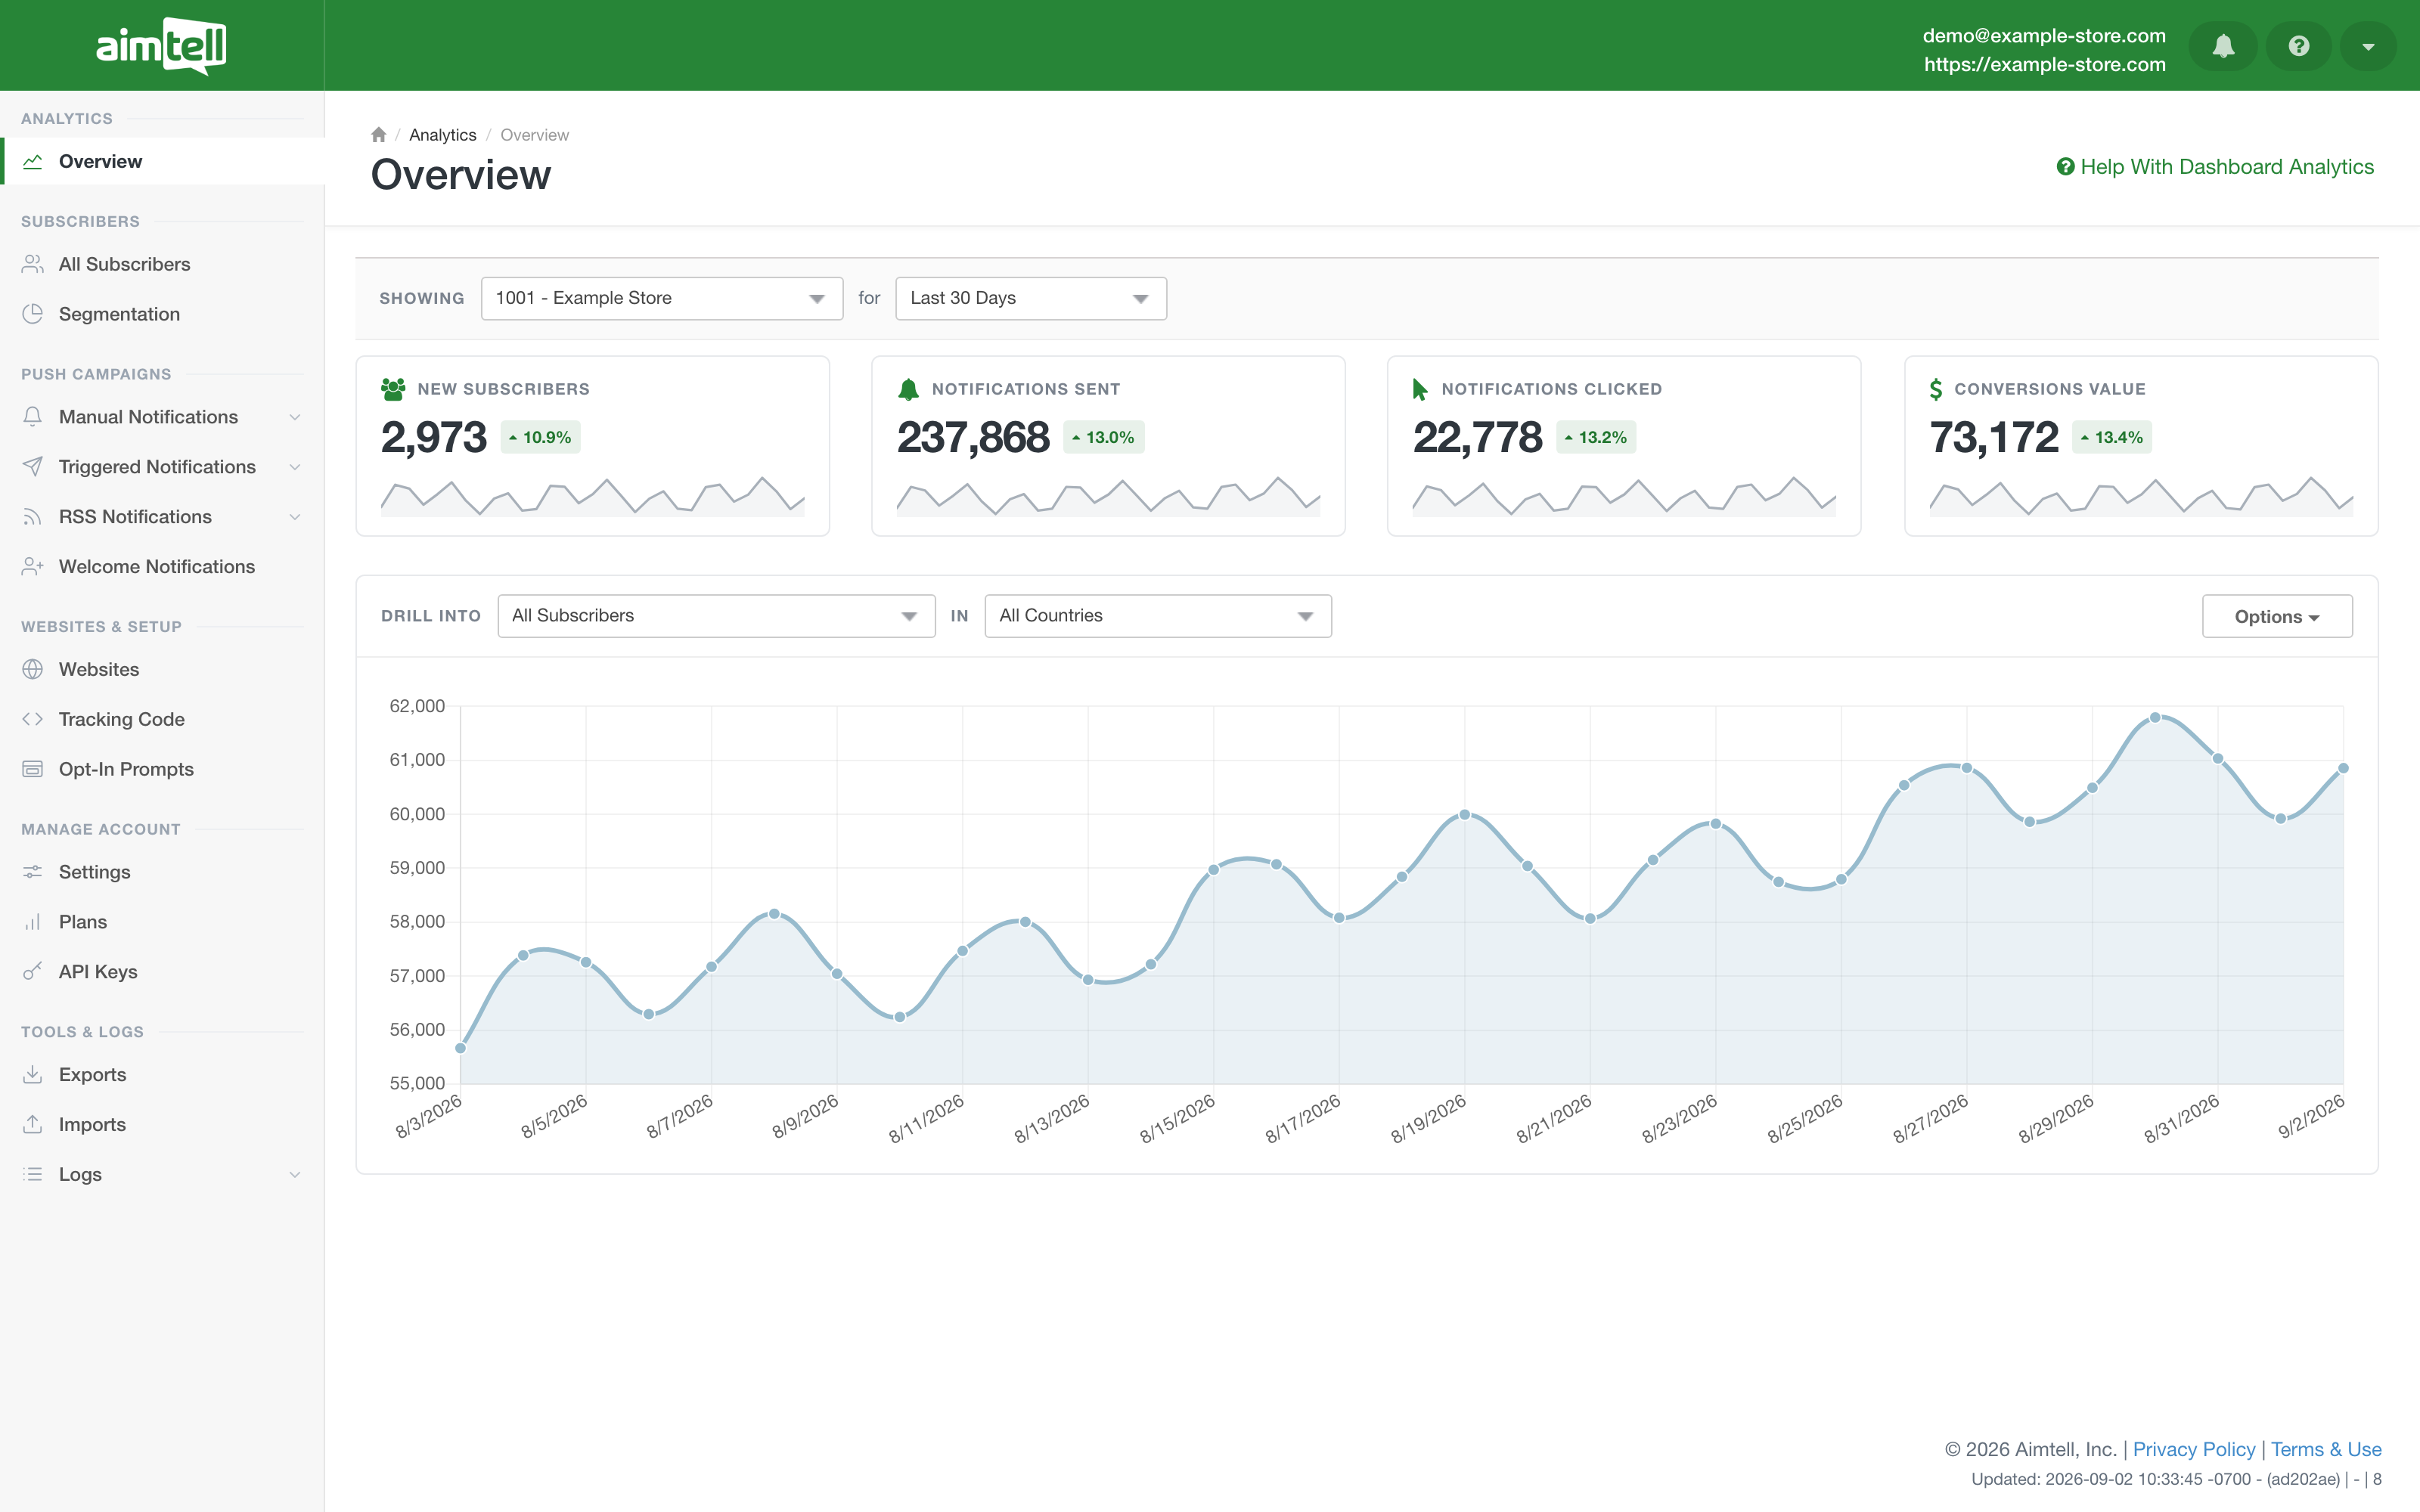
The dashboard provides a quick overview of everything that is happening with your websites. Data will default to the active site you are on, but you can adjust to view data from any site that you have access to or to view data from all of your sites.
Setting the scope
A single row at the top of the page — “Showing [site] for [range]” — sets the scope for everything below it. The site picker defaults to the site you are currently on, and can be changed to any other site you have access to, or to all of your sites at once.
The range picker holds Last 30 Days (the default), Last 90 Days, Current Quarter, Last Quarter and Year To Date. Choose “Custom Dates” to reveal a pair of start and end date fields and set your own window. The time the data was last refreshed is shown at the right-hand end of the same row.
The callouts
Underneath the scope row are four callouts: New Subscribers, Notifications Sent, Notifications Clicked and Conversions Value. Each one shows the figure for the range you selected, how it changed against the previous period of the same length, and a small sparkline of the trend.
Click any callout to load that report into the chart below it.
Drilling into a report
The card under the callouts holds the chart. Its header reads “Drill into [report] in [country]”, so you choose both what is charted and which country it is limited to.
There are many different reports you can view on the dashboard:
All Subscribers- Your total subscriber count.
New Subscribers- Users who opted-in to your site’s push notifications.
Notifications Sent- Cumulative total of all notifications sent out (manual, triggered, RSS, welcome).
Notifications Clicked- Cumulative total of all notifications clicked (manual, triggered, RSS, welcome).
Campaign Conversions- Cumulative total of all campaign conversions registered (manual, triggered).
Campaign Conversion Values- Cumulative total of the value of your conversions registered (manual, triggered, welcome).
New Subscribers (UTM Breakdown)- New subscribers drawn as a line per UTM source and medium. The eight largest pairs are charted individually and everything else is grouped as “Other”.
Opt-In Rate Percentage- Percentage of users which approved or accepted push notifications from your website. This number is based on the total number of users who received the prompt, not all users (since for instance, users on Safari on iPhone would not get the prompt).
Unsubscribed (Manual)- Number of subscribers who have voluntarily unsubscribed by changing their permissions. To learn more about this click here .
Unsubscribed (Inactive)- Number of subscribers that are automatically removed from the system after being deemed undeliverable. The system has built-in logic to keep subscribers active but once they’ve been deemed completely unreachable they will be removed automatically for you.
Unsubscribed (Purge)- Number of subscribers removed via the Automated Subscriber Segment Purge. You can define an optional segment which will automatically have matching subscribers purged/deleted each night. Up to 25k subscribers in the segment will be removed nightly.
Notifications Sent, Notifications Clicked, Campaign Conversions and Campaign Conversion Values can each be charted for all campaign types together or for a single one — Manual, Triggered, RSS, Welcome or API.
Note: ranges longer than about six months are charted a week at a time rather than a day at a time, so that a long window stays readable.
Chart notes
You can write notes against days on the chart to record what happened — a site migration, a big send, a change to your opt-in prompt. Any day that already has a note carries a small note marker on the chart, and hovering it previews the first note on that day.
- Add a note: click a point on the chart that has no marker. The note form opens on that date. Adjust the date if you need to, type your message and hit “Save Note”. On a weekly point the date defaults to the first day of that week, and the date field lets you move it to any other day inside it.
- Read notes: click a marker to open that day, which lists every note written against it along with who wrote it. Aimtell also publishes account-wide notes, which appear here alongside your own. The day’s “Add Note” button writes another one against the same date.
- Edit or delete: your own notes carry Edit and Delete links in the list. Deleting asks you to confirm in place.
Notes are plain text and visible to everyone with access to the site. Because a note belongs to a single site, notes are not shown while the site picker is set to all sites.
Options
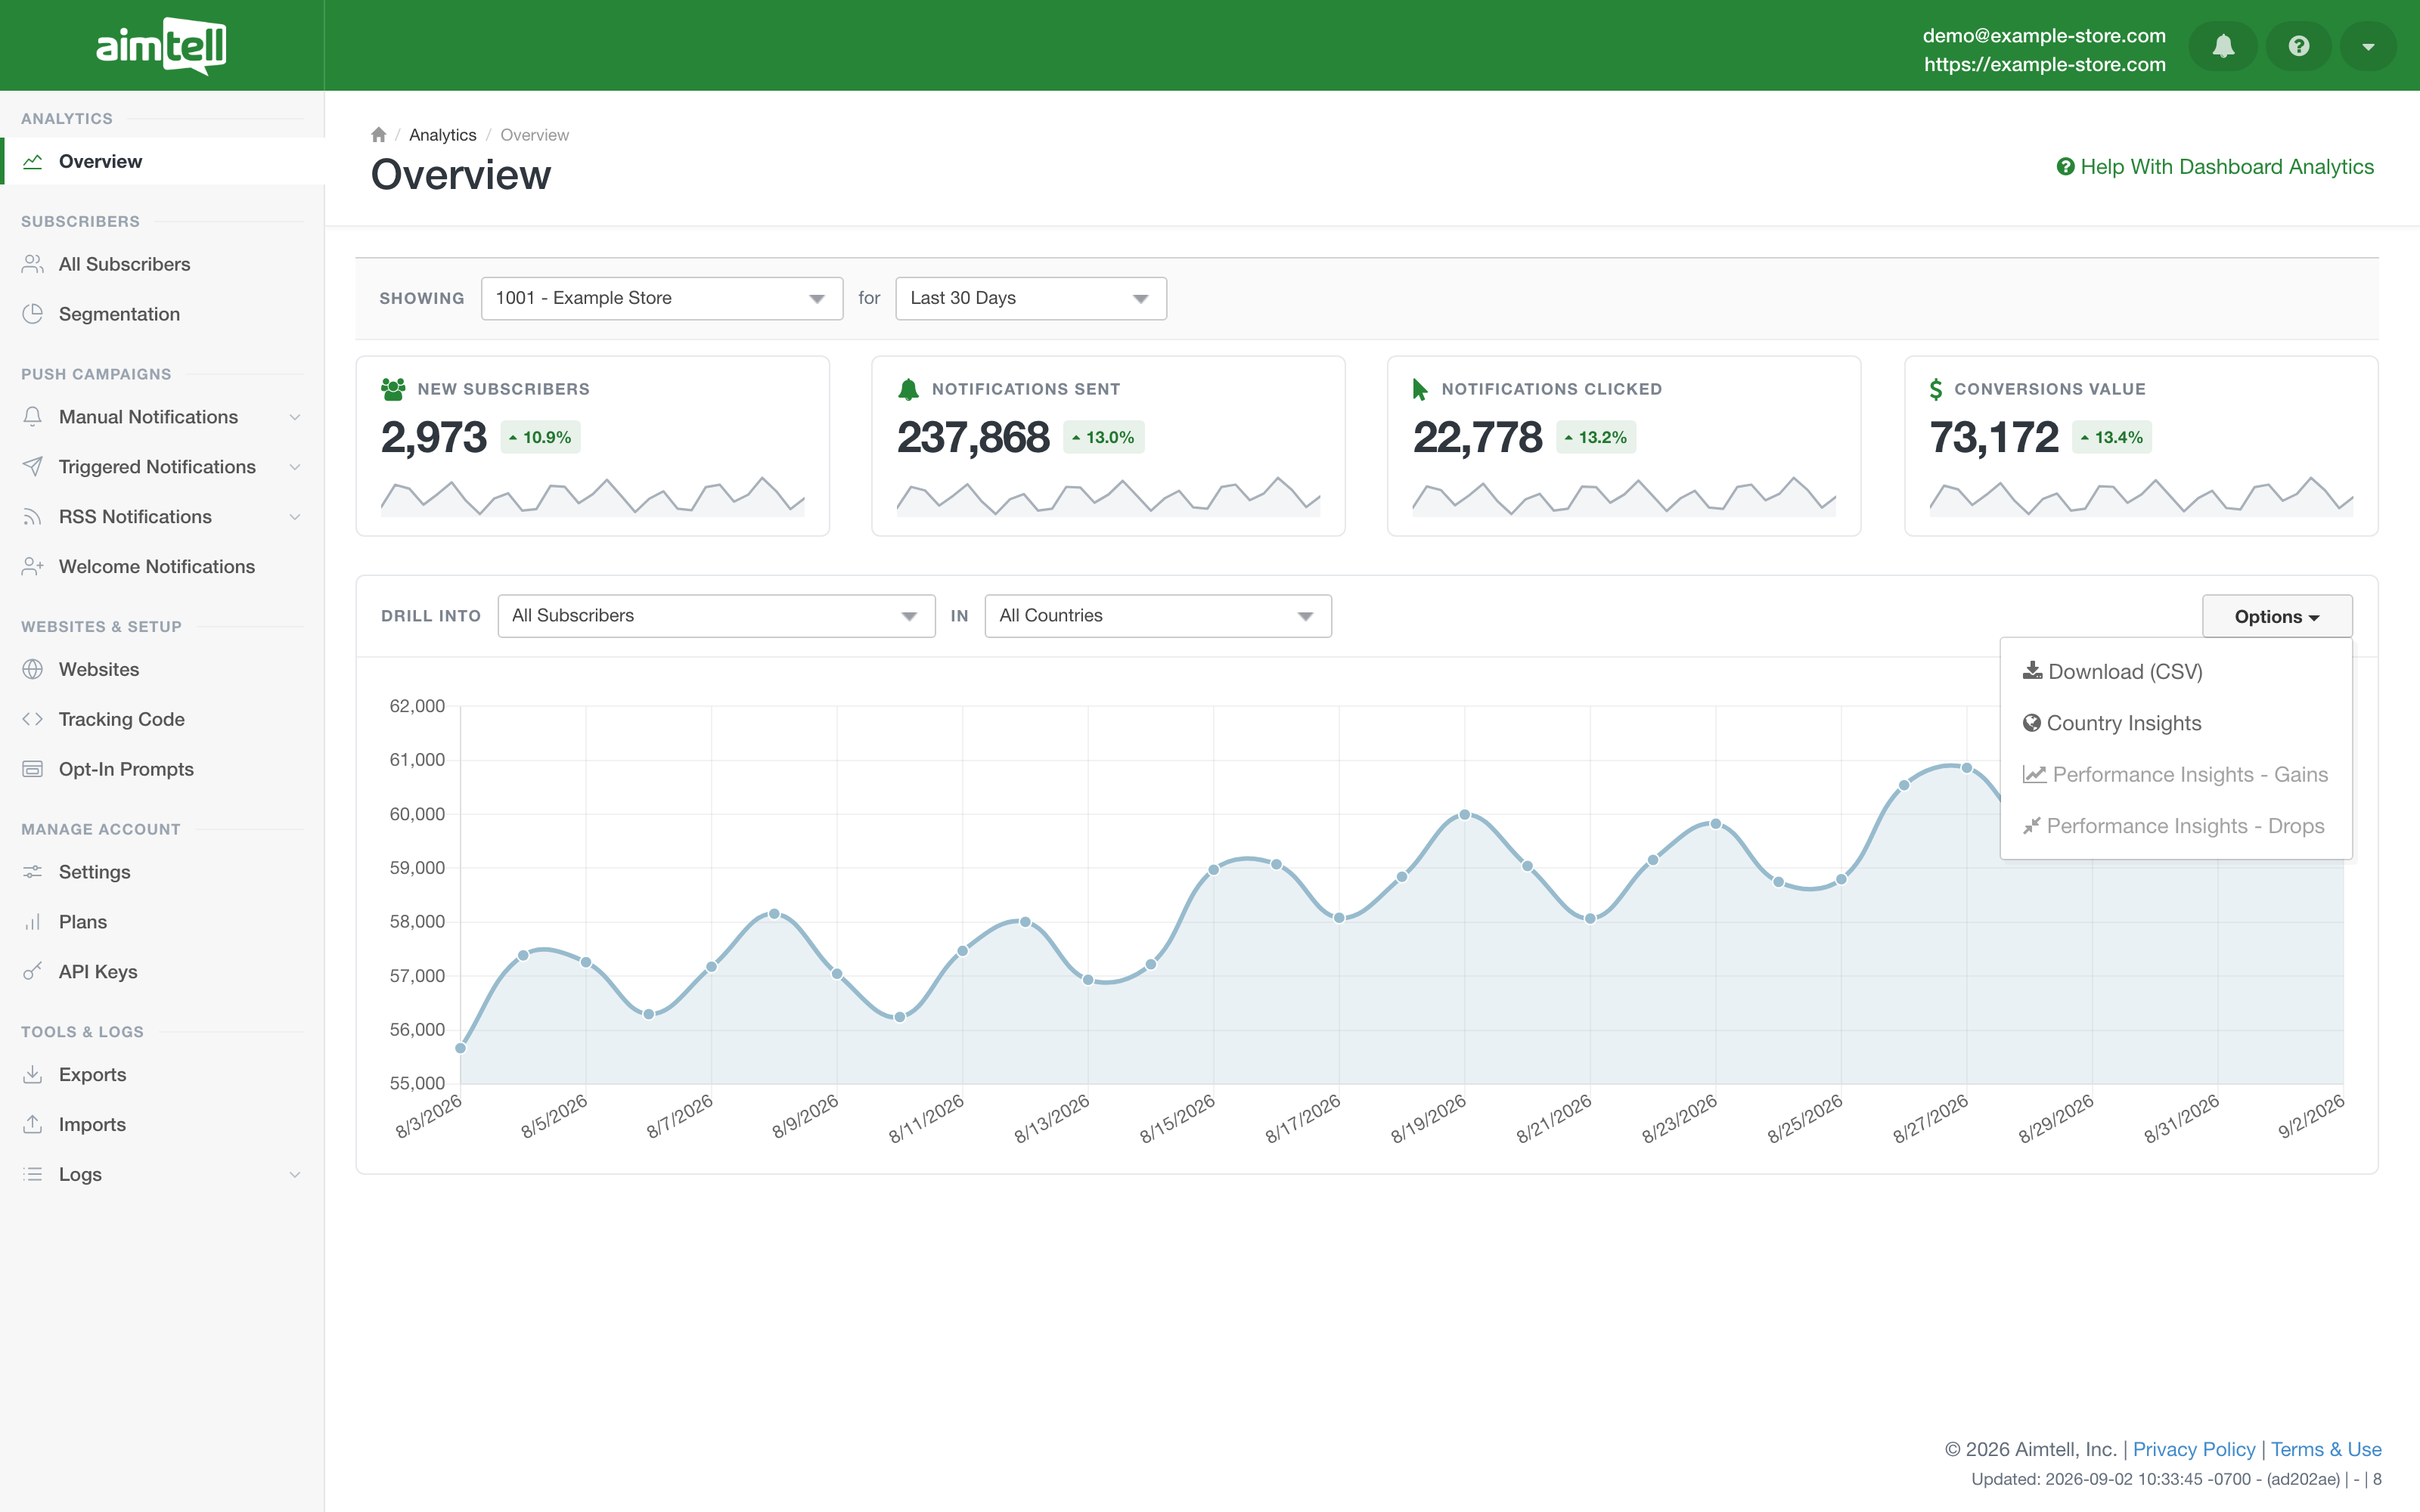
The “Options” menu on the chart card holds:
- Download (CSV)- Exports the data behind the report you are currently viewing.
- Country Insights- A breakdown of the current report by country.
- Performance Insights - Gains and Performance Insights - Drops- A quick overview of how your top ten websites are performing with regards to gains and drops in subscribers, based on the average of the date range and selected end date. A pop-up window displays the averages for the top ten performing sites from the timeframe you selected.