Viewing Your Websites
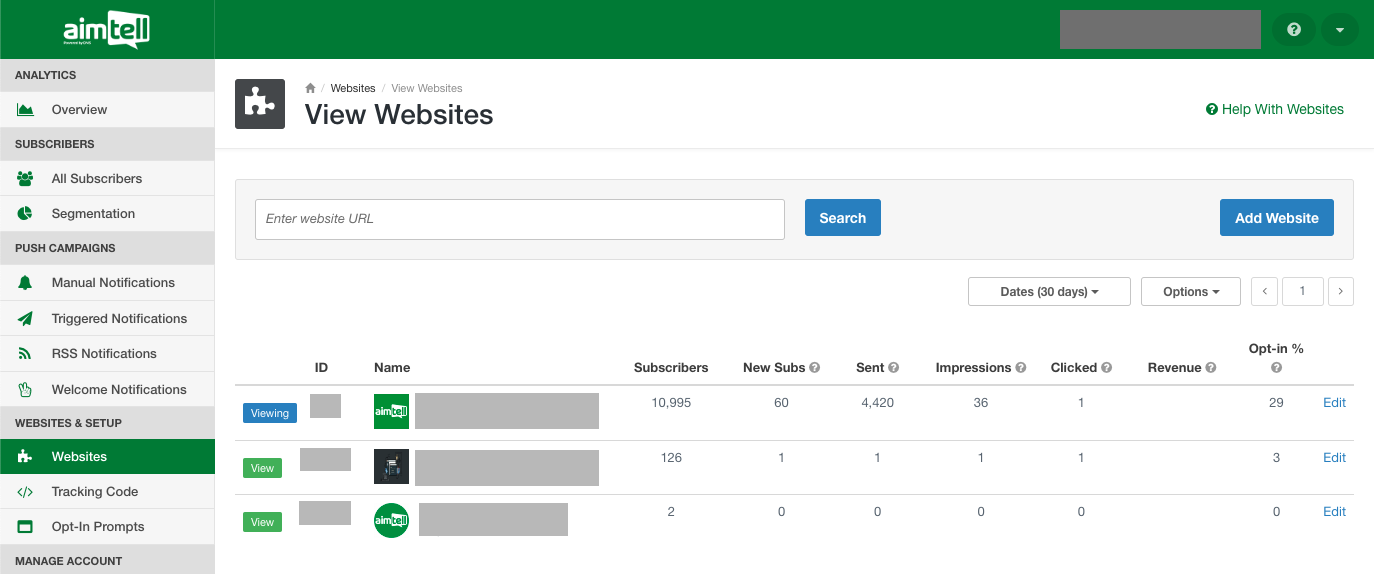
If you manage web push notifications for more than one website, there is an easy way to see how they are all performing without having to go to each website individually. Instead, head to your Aimtell dashboard and click ‘Websites’ from the sidebar.

On this screen, you will see all of the websites that you currently have access to. The first column will tell you the total amount of subscribers that each website has.
The following 3 columns will give you a snapshot of how each website has performed over a certain period of time, telling you how many new subscribers you earned, the number of notifications sent, the number of notifications clicked, impressions, and revenue.
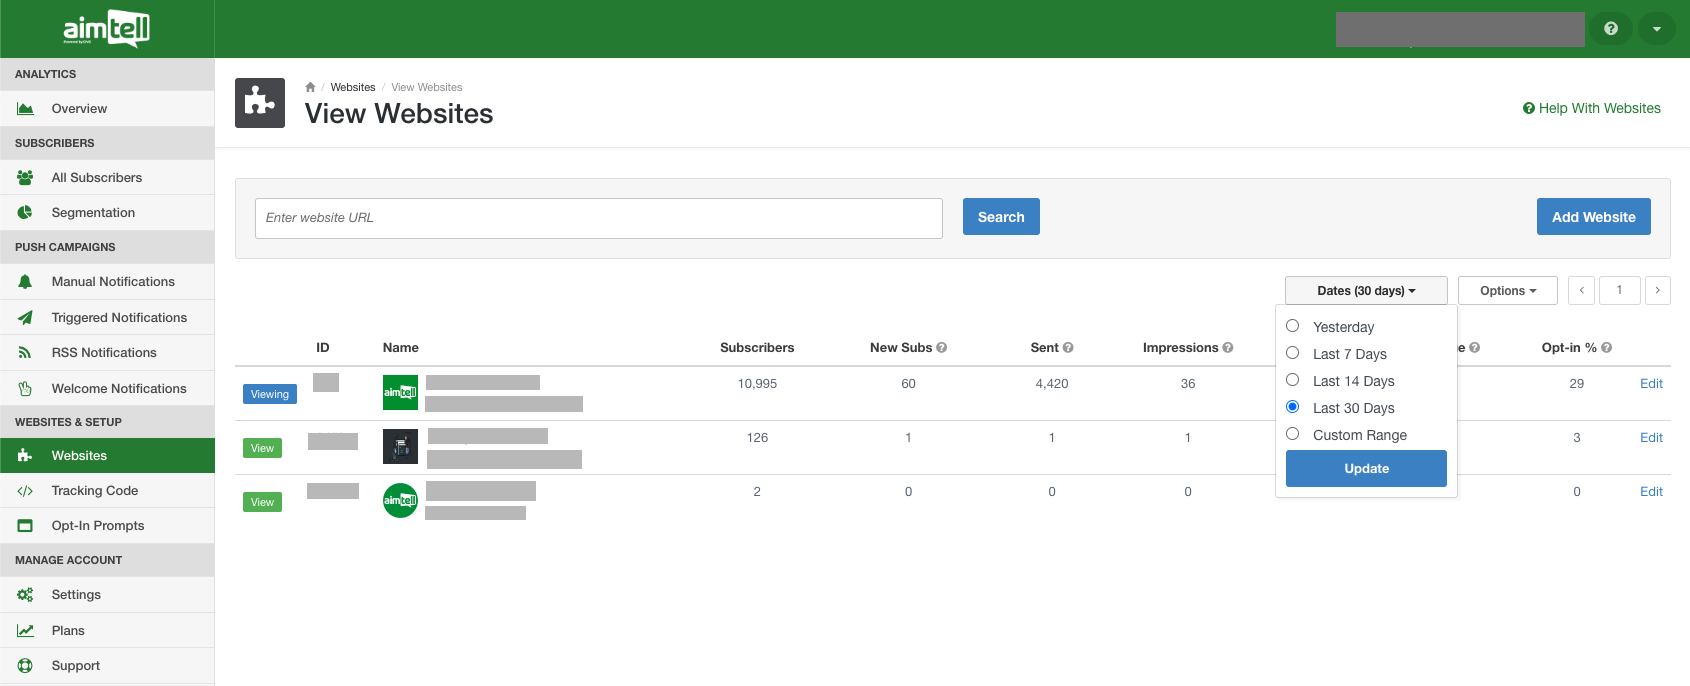
The numbers will default to the last 30 days, but you can also select a custom date range if you prefer. To do this, click on ‘Dates (30 Days)’ and then ‘Custom Range.’

Input the start and end date you want and hit ‘Update’ to see stats during that period of time. You can also easily sort your websites in ascending or descending order based on any of these four columns.
For easy reporting, hit ‘Options.’ There are two report options you can choose from. ‘Download’ will provide you with overview information about your sites- your subscribers, new subscribers, and notifications sent and clicked during the specified time period. Choosing ‘Download Detailed’ will provide you with a daily breakdown of your data instead of an overview.
